


TP10 - Monitoring & Reporting
1. Cloudwatch Introduction
definition
CW is a monitoring service to monitor your AWS resources, as well as the applications that you run on AWS
what can we monitor with CW
-
Compute
- autoscaling group
- elastics load balancers
- route53 Heatlth checks
-
Storage & Content delivery
- EBS VOlumes
- Storage Gateays
- CloudFront
-
Database & Analytics
- DynamoDB
- ELasticache Nodes
- RDS Instances
- Elastics MapReduce Job Flows
- Redshift
-
Other
- SNS Topics
- SQS queuss
- pswork
- CloudWatch Logs
- Estimate Charge on your AWS Build
CloudWatch and EC2
When CW comes on EC2, it monirtores by default :
-
Host Level Metrics consist of :
- CPU
- Network
- Disk
- Status Check
- custom metrics : by default EC2 monitoring is** 5 minutes interfvales, unless you enable detailed monitoring hich will then make it a **1 minute intervals (1 minutes is the minimum)
How long are CW metrics Stored
-
you can retrieve this data
- with GetMetricStatistics API or by using thirds party tools offereds by AWS parteners
- from any terminated EC2 or ELB instane after its termination
- CW Logs will store your log data indefinitely, but you can change retention time for each LOg Group at any time
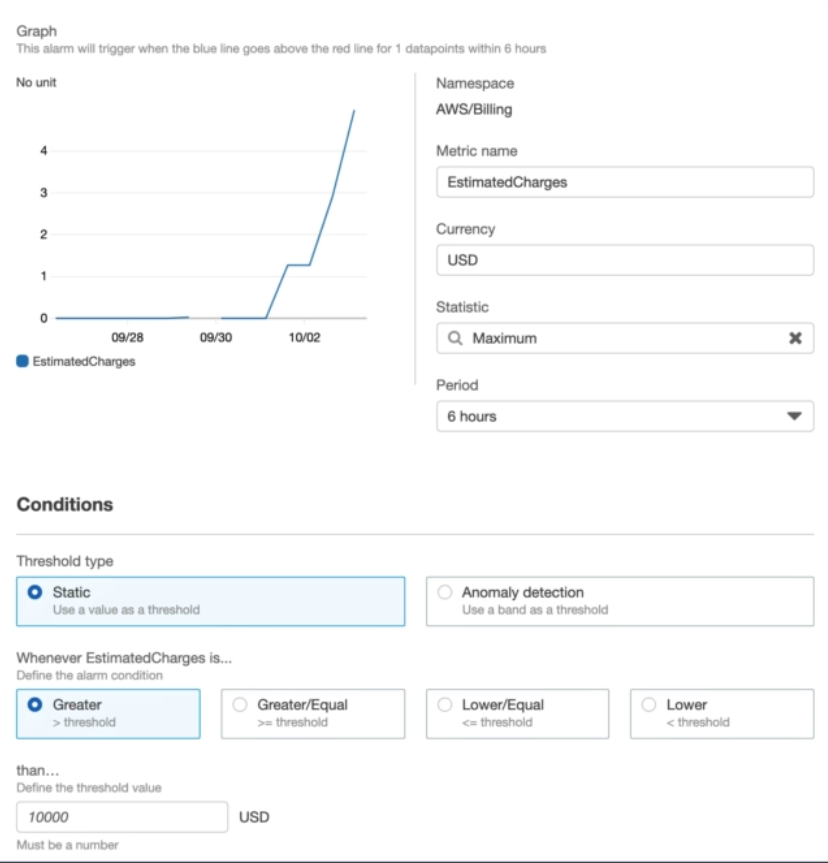
CloudWatch Alarms
You can create an alarm to monitor any Amazon CloudWatch metric in your account, with appropriate thresholds and with defined actiosn triggered.
It includes :
- EC2 CPU Utilization
- ELB Latency
- charges on your AWS bill
2. Monitoring EC2 With Custom Metrics
edit the crontab
lowest granularity is 1 minutes
3. Monitoring EBS
EBS = virutal disk in the cloud
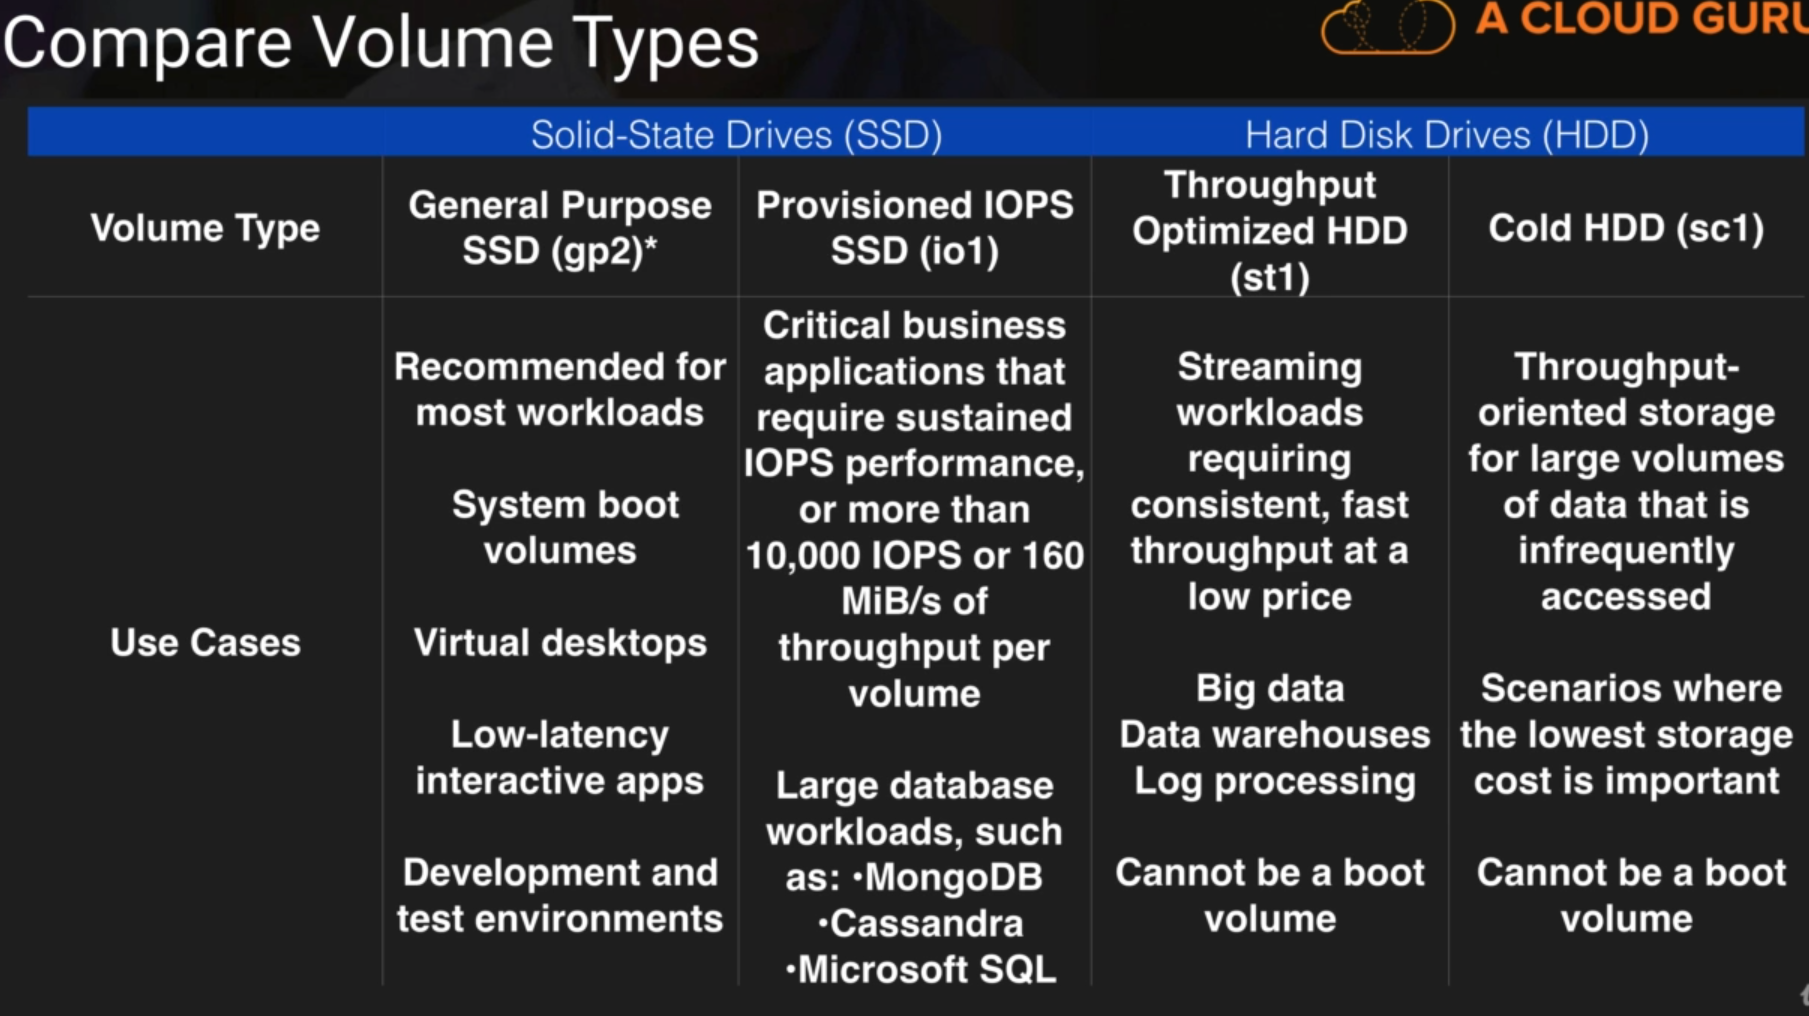
4 different volume types
- SSD : Solid State Drives
- HDD : hard Disk Drives
- general purpose (SSD) : grp2
- provisioned IOPS (SSD) : io1
- Throughtput Optimized (HDD) : st1
- Cold (HDD) : sc1
Uses cases
IOPS & Volumes Examples
- Volume Read Ops/ VOlume Write OPS = total number of IO Ops in a specific period of time. So say 1 000 in 1 minute ) 100/60 = IOPS
- Volume Queue Length = Number of read operations and write operation request waiting to be completed in a specific period of time
IOPS
IOPS are a unit of measure representing input/output operations per second. The operations are measured in KiB, and the underlying drive technology determines the maximum amount of data that a volume type counts as a single I/O. I/O size is capped at 256 KiB for SSD volumes and 1,024 KiB for HDD volumes because SSD volumes handle small or random I/O much more efficiently than HDD volumes.
IOPS per GiB of volume size
Genral Purpose SSD volumes have a base of 3 IOPS per GiB of volume size.
- Mximum Volume SIze of 16_284 GiB
- Maximum IOPS SIze of 10 000 IOPS Total
So the bigger is the volume, the more performance you get, untill 10 000 IOPS (from 3 000).
Thus, if we burst our 100 GiB (-> 3IOPS * 100 = 300 IOPS) volume to 3000 IOPS, the burst will be 2700 (3000 - 300 )
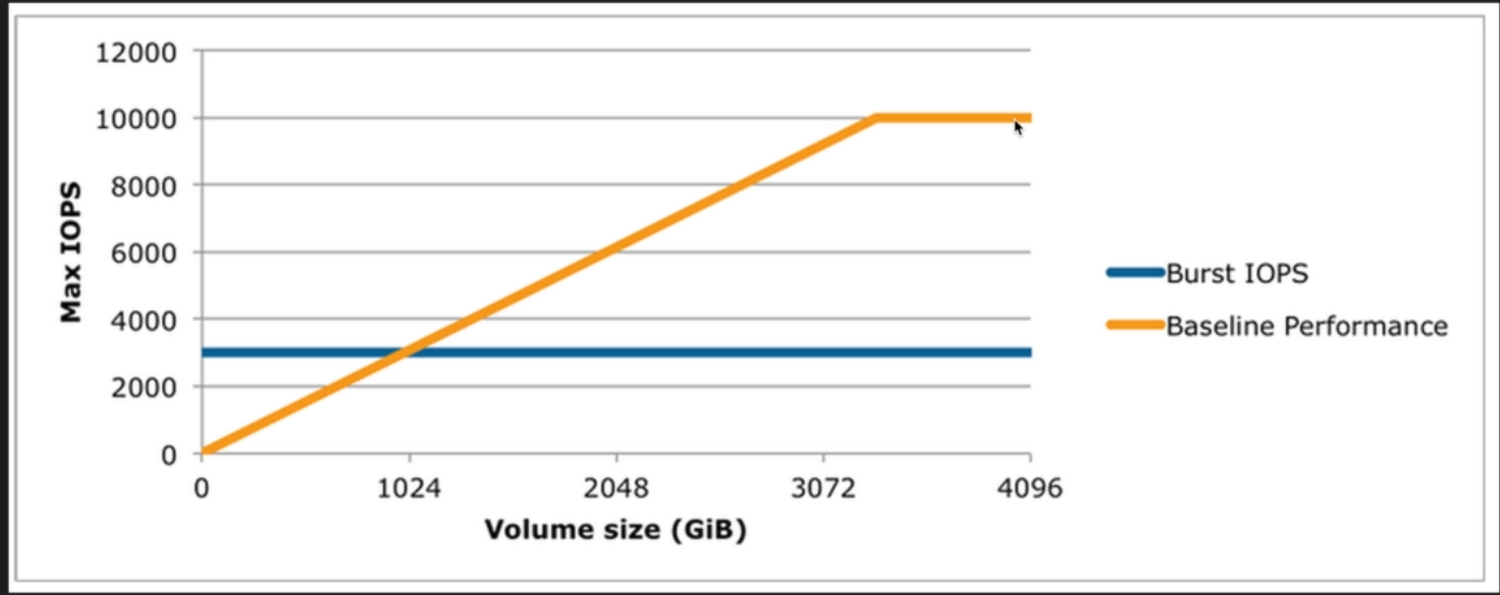
Above 10 000 IOPS (Y axis), :
- you will not use general SSD purpose anymore, but a bigger volumes
- you will provisional IOPS
I/O Credits
- Each volume receives an initial I/O credits balance of 5 400 000 I/O credits
- This is enough to sustain the maximum burst performance of 3 000 IPOS for 30 minutes
- When you are going over your provisioned IO Level (ie bursting) you will be earning credits.
Pre Warming EBS Volumes
Les volumes EBS vides reçoivent leurs performances maximum au moment où ils sont créés et ne nécessitent pas d'initialisation (anciennement préchauffage).
Concernant les volumes ayant été créés à partir d'instantanés, les blocs de stockage doivent être extraits d'Amazon S3 et écrits sur le volume pour que vous puissiez y accéder. Cette action préalable prend du temps et peut causer une hausse significative de la latence des opérations d'E/S lors du premier accès à chaque bloc. Les performances du volume sont obtenues une fois que tous les blocs ont été téléchargés et écrits sur le volume.
Pour éviter cette baisse de performances initiale dans un environnement de production, vous pouvez utiliser l'une des solutions suivantes :
- Forcez l'initialisation immédiate de la totalité du volume. Pour plus d'informations, consultez Initialisation des volumes Amazon EBS sur Linux.
- Activez la restauration d’instantané rapide sur un instantané pour vous assurer que les volumes EBS créés à partir de l’instantané sont entièrement initialisés à la création et fournissent instantanément la totalité des performances allouées. Pour plus d'informations, consultez Restauration d'instantané rapide Amazon EBS.
EBS cloudwatch metrics
L'espace de noms AWS/EBS inclut les métriques suivantes pour les volumes EBS. Pour obtenir des informations sur l'espace disque disponible à partir du système d'exploitation sur une instance, veuillez consulter Affichage de l'espace disque disponible.
Volume Status Checks
Amazon Web Services (AWS) fournit automatiquement les données que vous pouvez utiliser pour surveiller vos volumes Amazon Elastic Block Store (Amazon EBS).
Le tableau suivant répertorie les statuts des volumes Amazon EBS.
| Statut du volume | Statut d'activation des E/S | Statut des performances d'E/S (uniquement disponible pour les volumes IOPS provisionnés) |
|---|---|---|
ok |
Activé (E/S activées ou E/S activées automatiquement) | Normal (performances du volume telles qu'attendues) |
warning |
Activé (E/S activées ou E/S activées automatiquement) | Dégradé (performances du volume inférieures aux attentes) Profondément dégradé (performances du volume bien inférieures aux attentes) |
impaired |
Activé (E/S activées ou E/S activées automatiquement) Désactivé (volume hors connexion et récupération en attente, ou en attente d'activation par l'utilisateur des E/S) | Interrompu (performances du volume profondément impactées) Non disponible (impossible de déterminer les performances d'E/S parce que les E/S sont désactivées) |
insufficient-data |
Activé (E/S activées ou E/S activées automatiquement) Données insuffisantes | Données insuffisantes |
- Warning = Degraded or Severely Degraded
- Impaired = Stalled or Not Available
Modifying EBS volumes
If you Amazon EBS Volume is attached to a current generation EC2 instance type, you can, whitout detaching it. :
- increase its size,
- change its volume type,
- or (for an io1 volume) adjust its IOPS performance
If they are detached, you can as well :
- issue the modification command (console or command line)
- monitor the progress of the modification
- if the size of the volume was modified extend the volume's file system to take advatage of the increased storage capacity.
4. Monitoring ELB
Elastoc Load Balancer
3 Types of ELB
3 Differet Types of Elastic Load Balancers :
- Application Load Balancer
- Network Load Balancer
- Classic Load Balancer
4 Different ways to monitor your Load Balancer
- CloudWatch metrics
- Access logs
- Request tracing
- CloudTrail logs
CloudWatch vs CloudTrail
- CloudWatch -> performance
- CloudTrail -> API calls in the AWS plateform
CloudWatch Metrics
ELB publishes to Amazon CloudWatch, for your load balancers and your targets :
- metrics = variable monitor
- and datapoints = values of that variable over time
Access Logs
Access logs = information about request :
- the time
- the client IP adress
- the latencies
- request paths
- server responses
Access logging = optional feature of ELB disabled by default. It enables the store of access logs in a S3 bucket in compressed files.
It is still possible to trace these errors using Access Logs which would be stored on S3.
Access Logs can store data where the EC2 instance has been deleted.
Request Tracing
Available for Application Load Balancers only
You can use request tracing to track HTTP request from clients to targets or other services -> adding W-AWS-Trace-Id header before sending request to the target.
CloudTrail
To capture calls made to the ELB API and store them as log files in Amazon S3.
Used to determine the following details :
- calls,
- source IP address where the call came from,
- who made the call
- when the call was made
5. Monitoring Elasticache
Elasticach = 2 engines :
- Memcached
- Redis
4 important things to look at :
- CPU Utilization
- Swap Usage
- Evictions
- Concurrent Connections
Comparison
| Memcached | Redis | |
|---|---|---|
| CPU Utilization | Multi-threaded Loads up to 90% ; if exceeds -> add more nodes to the cluster |
Mono-threaded Threshold = 90 / number of cores |
| Swap Usage | Should be around 0 most of the time, should not exceed 50Mb. If it is the case -> increase the memcached connections overhead parametes |
No SwapUsage metric Use reserved-memory |
| Evictions | No recommended settings Scale OUT (add more nodes) Scale UP (increasing the memory of existing nodes) |
No recommended settings Scale OUT (add replicas) only |
| Concurrent Connections | No recommended settings | No recommended settings |
Swap Usage
- Swap Usage = Amoun of the Swap file that is used
- Sap Fionlyonlyle (or Paging File) = Amount of disk storage space reservec on disk if your computer runs out of RAM
Evictions
An Evictions occurs when a new item is added and an old item must be removed due to lake of free space in the system.
Concurent connections
If there is a large spike in the number of concurrent connections this can either mean :
- a large traffic spike
- or your application is not releasing connections as it should be
Remember to set an alarm on number of concurrent connections for Elasticache.
6. Metrics From Multiple Regions & Custom Dashboards
CloudWatch - Dashboards are multi-region and can display any widget to any region.
To ad the widget, change to the region that you need and then add the widget to the dashboard.
7. Create A Billing Alarm
8. AWS Organisations Lab
Definition
AWS Organisations = allows you to manage multiple AWS accounts at once. You can create groups of accounts and then apply policies to those groups
- Centrally manage policies across multiple AWS Accounts
- Control Access To AWS Services
- Automate AWS Account Creation And Management
- Consolidate Billing Across Multiple AWS accounts
Central Management
Centralization of policies management across multiple accounts
Control Access
Allow or Deny individuals AWS Services using Service Control Policies (SCPs).
Even if IAM in an accounts allows a resource not allowed by SCP, this last will override it.
Automate AWS Account Creation
Automate the creation and management of new AWS Accounts
Consolidated Billing
Set up a single payment method for all the AWS accounts in your organization through consolidated billing.
9. AWS Resource Groups & Tagging
Tags definition
- Key Value Pairs attached to AWS resource
- Metadata
- can be inherited
Resource Groups
It is a way of grouping tags
Group your resource using the tafs that are assigned to them.
Resource groups can contain foloowing tags :
- region
- Name
- Health Check
You can use resource groups with AWS Systems manager to automate task
10. Cost Explorer and Cost Allocation Tags
AWS Cost Explorer has an easy-to-use interface that lets you visualize, understand, and manage your AWS costs and usage over time. You can view data up to last 13months and get recommandation.
- Use tags to tag your resources
- Configure tags for cost centres (such as department, employee id etc.)
- Activate cost allocation tags to track you costs by tags
11. EC2 Pricing Models
EC2 options :
- On Demand : allow you to pay a fixed rate by the hour (or second) with no commitment
- Reserved : provide you with a capacity reservation, and offer a significant discount on the hourly carge for an instance
- Spot : enable you to bid whatever price you wnat for instance capacity, providing savings if your app have flexible start and end times
- Dedicated Hosts : Physical EC2 server dedicated for your use. DH can reduce costs by allowing you to use your existing server-bound software licenses.
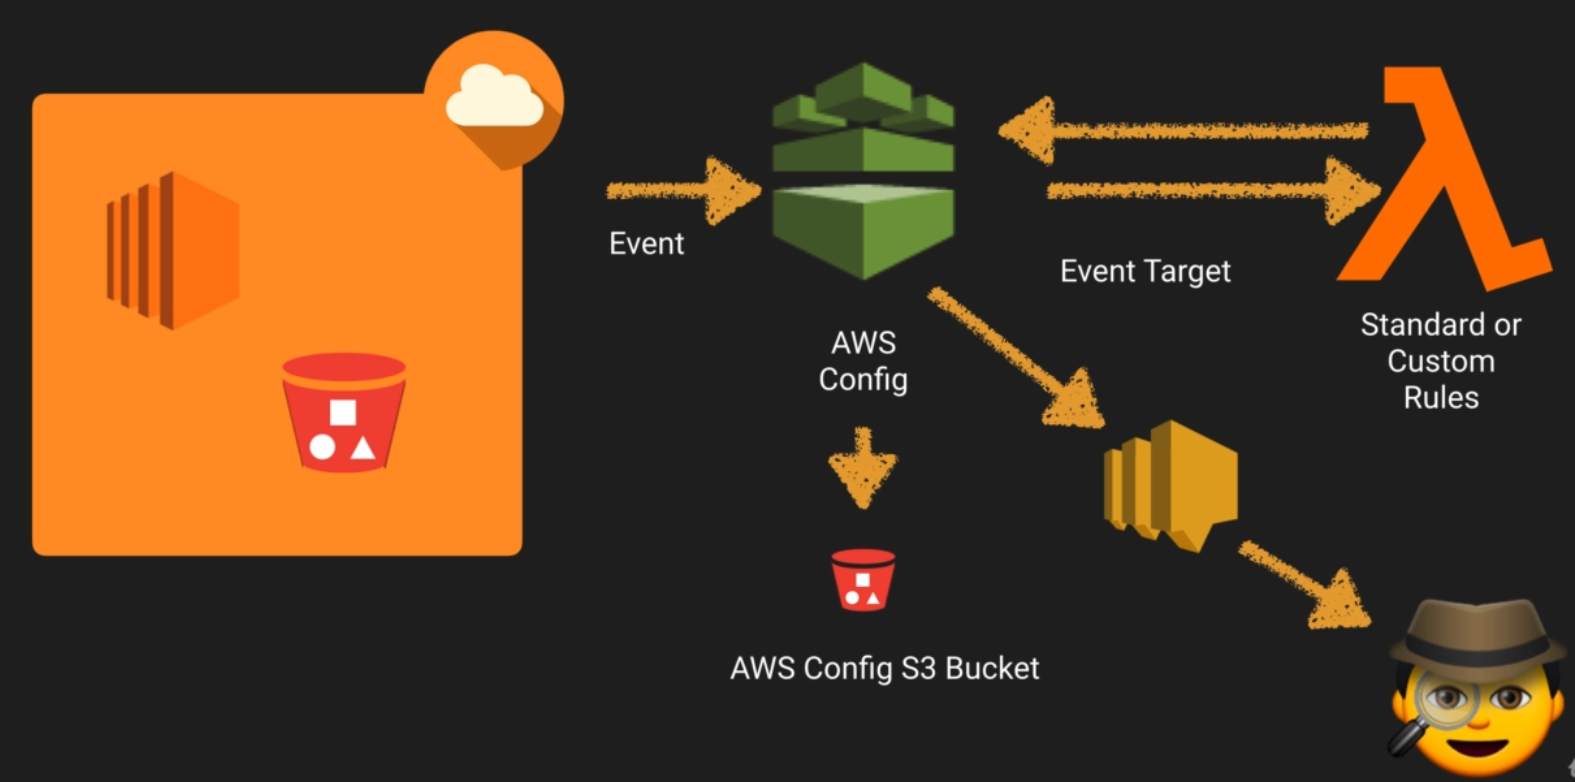
12. AWS Config 101
With AWS Config, you are able to continuously monitor and record configuration changes of your AWS resources. Config also enables you to inventory your AWS resources, the configurations of your AWS resources, as well as software configurations within EC2 instances at any point in time. Once change from a previous state is detected, an Amazon Simple Notification Service (SNS) notification can be delivered for you to review and take action.
-
Enables :
- compliance auditing
- security analysis
- resource tracking
-
Provides :
- Configurations snapshot and logs config changes of AWS resources
- Automated compliance checking
-
Key components
- Config Dashboard
-
Config Rules
- Managed
- Custom
- Resources
- Settings
13. AWS Config Lab
Compliance checks
-
Trigger
- Periodic
- Configuration changes
-
Managed rules
- About 40
- Basic, fundamental
Permission needed for config
-
AWS Config requires an IAM Role with :
- Read only permissions to the recorded resources.
- Write access to S3 logging bucket
- Publish access to SNS
Restrict Access :
- Users need to be authentificated with AWS and have the appropriate permissions set via IAM policies to gain access
- Only Admins needing to set up and manage Config require full access
- provide read only permissions or Config day to day use.
Monitoring Config :
- Use CloudTrail with COnfig to provide deeper insight into resources
- Use CloudTrail to monitor access to config such as someone stopping the Config Recorder
14. AWS Config Vs AWS CloudTrail Vs CloudWatch
All of these monitors somethings :
| Config | CloudTrail | CloudWatch |
|---|---|---|
| performance | API calls in the AWS platform | state of your AWS environment |
CloudWatch can notify you of changes.
15. Health Dashboards
2 types of Dashboards :
- Health : shows the health of each AWS Service as a whole per region
- Personal : provides alert and remediation guidance when AWS is experiencing events that may impact you
Service Health Dashboard


